How to Measure ROI of an AI Recruiting Platform
Learn how to measure ROI on your AI recruiting platform with the right formula, baselines, and metrics. Built for HR leaders who need to prove the business case.

By: Anubhav Kumar
Compliance, Tax and Finance Manager
Published
Updated
Edited by Craze Editorial Team · See our Editorial Process
You added AI to your recruiting workflow. Screening is faster. Scheduling takes fewer emails. Your team handles more reqs than before. But when finance asks, “What is the actual return on this investment?”, the answer often comes down to gut feel and anecdotal wins.
That gap between knowing AI helps and proving how much it helps is where most hiring teams get stuck. A recruiter on r/hiretruffle asked it directly: “Has anyone actually measured ROI on AI recruiting?” The answers were mostly vague. And the broader data tells the same story: Atlassian’s 2025 AI Collaboration Report found that 96% of executives say AI has not delivered meaningful ROI, not because the technology fails, but because organizations lack a clear measurement process.
This guide walks through how to measure AI recruiting ROI with a framework that holds up to CFO scrutiny: what to track, how to set a baseline, how to run a proper pilot, and how to present the results so leadership actually acts on them.
TL;DR
- AI recruiting can deliver 3x to 5x ROI in year one, but only when measured against a credible pre-AI baseline and paired with process redesign.
- The ROI formula is simple. The hard part is defining what counts as benefits and costs for your specific operation.
- Track six core metrics: recruiter hours saved, cost-per-hire reduction, time-to-fill improvement, quality-of-hire proxies, agency spend avoidance, and offer acceptance rate.
- Run a 60 to 90-day controlled pilot before making ROI claims. Compare AI-assisted workflows against traditional ones for the same role types.
- Most teams overestimate ROI by ignoring implementation costs and measuring activity (resumes screened) instead of outcomes (better hires, lower cost).
Why AI Recruiting ROI Is Hard to Pin Down
The vendor pitch is always clean: adopt the tool, watch the metrics improve. But several structural problems make AI recruiting ROI harder to measure than most technology investments.
Vendor numbers come from best-case implementations: When a platform claims “30% lower cost-per-hire,” that figure typically comes from a well-resourced team with clean ATS data, a dedicated implementation lead, and enough hiring volume to produce meaningful results. Median outcomes are less dramatic.
Industry averages are moving in the wrong direction: SHRM’s 2025 benchmarking data shows the average US non-executive cost-per-hire is $5,475, and this number has been rising over the past three years despite widespread AI adoption. The executive average sits at $35,879. Adoption alone is clearly not producing savings at scale.
Personal productivity gains do not equal organizational ROI: The Atlassian report found that 76% of leaders focus on personal productivity as their main AI success metric. But organizations fixated on individual productivity are 16% less likely to achieve broader transformation than the 4% seeing real results. In recruiting terms: a recruiter screening resumes faster does not automatically mean the team is making better hires at lower cost.
Most teams skip the baseline: Without pre-deployment data on cost-per-hire, time-to-fill, and recruiter time allocation, there is no “before” to compare against. Every improvement claim becomes a guess.
Attribution is messy: When cost-per-hire drops, it could be the AI tool, a salary adjustment that attracted more candidates, a stronger employer brand, or a softer job market. Without controlled measurement, you cannot isolate the AI tool’s contribution.
Understanding these problems is not an argument against AI recruiting. It is the case for measuring it properly. And that starts with getting the formula right, along with what actually goes into it.
The AI Recruiting ROI Formula (and What Actually Goes Into It)
The Basic Formula
ROI (%) = [(Total Benefits - Total Costs) / Total Costs] x 100
This formula is universal and simple. The challenge is not the math. It is knowing what to include on each side of the equation.
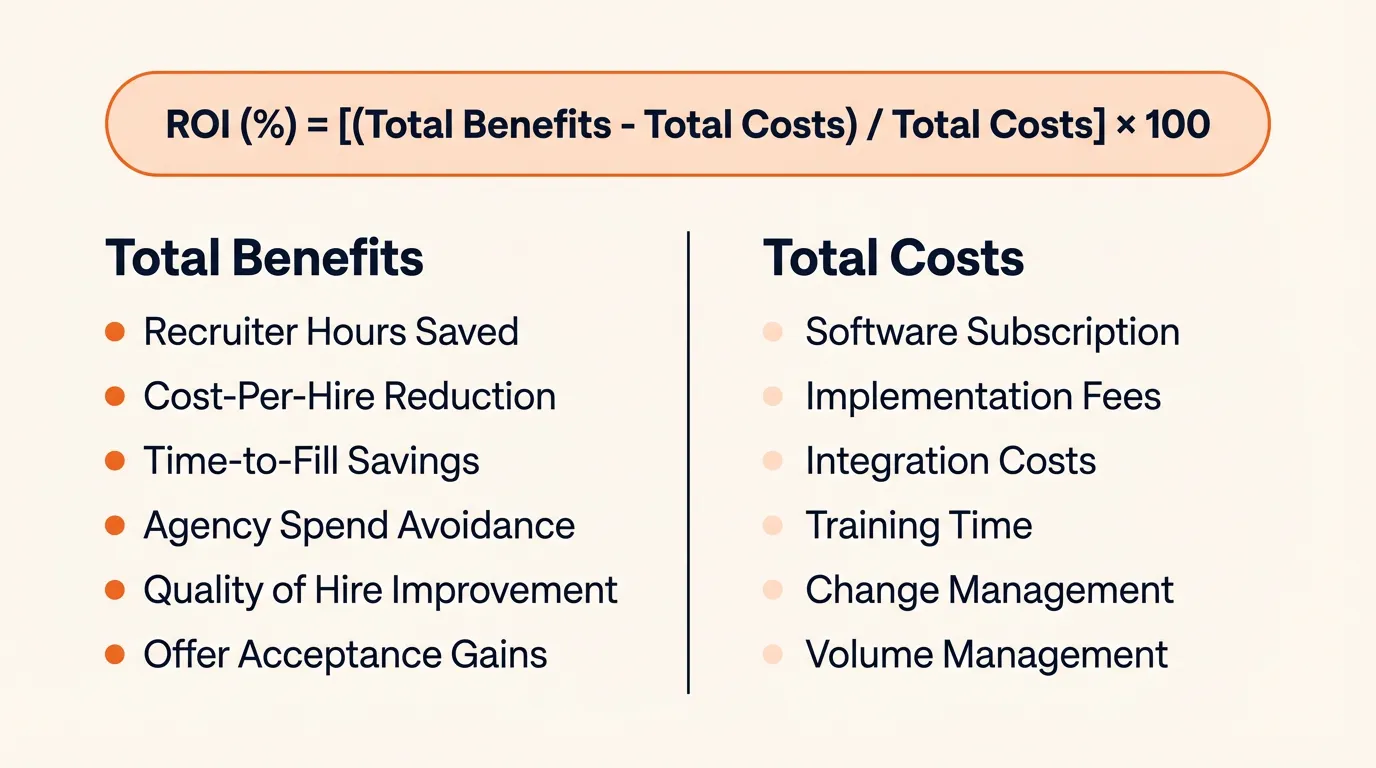
What Counts as “Benefits”
AI recruiting benefits fall into two categories: hard savings you can put a dollar figure on, and strategic improvements that show up in hiring quality and retention over time.
Recruiter hours saved per requisition: AI screening tools typically save 15 to 30 minutes per candidate on initial review. Scheduling automation saves another 5 to 8 hours per week. To monetize: multiply hours saved by the recruiter’s fully loaded hourly rate (salary plus benefits plus overhead, divided by annual working hours).
Cost-per-hire reduction: When AI handles screening, outreach, and scheduling, each hire costs less in recruiter time and process overhead. Industry data suggests 30 to 40% reductions in direct cost-per-hire for fully implemented programs. Partial implementations (screening only, or scheduling only) typically produce smaller gains in the 15 to 25% range.
Time-to-fill reduction: Organizations using AI-powered matching and scheduling report 30 to 50% faster time-to-fill. This is where the financial impact gets significant. To monetize:
- Cost of vacancy per day = (annual salary / 260 working days) x a productivity multiplier (typically 1.5x to 3x, depending on the role’s revenue impact)
- Total savings = days saved x cost of vacancy per day x number of hires
Agency spend avoidance: This can be the single largest ROI component. If AI sourcing and screening let you fill roles in-house that previously went to agencies charging 15 to 30% of first-year salary, the savings are direct. For a $75,000 role, that is $11,250 to $22,500 per placement avoided.
Quality-of-hire improvement: The hardest to quantify, but often the highest long-term value. Use proxy metrics rather than trying to assign a single dollar figure:
- 90-day and 1-year retention rates for AI-assisted hires vs pre-AI hires
- Hiring manager satisfaction scores
- Time to full productivity
- First-year performance ratings
If AI-assisted hires retain at 85% (1-year) vs 70% for pre-AI hires, calculate the cost of the avoided turnover (typically 50 to 200% of annual salary per bad hire, depending on role level).
Offer acceptance rate improvement: Faster, more responsive processes can improve offer acceptance rates, reducing the cost of re-opening requisitions.
What Counts as “Costs”
This is where most ROI calculations fall apart. Teams include the subscription fee and stop there.
A credible total cost of ownership includes:
- Annual software subscription (per-seat, per-hire, or flat rate)
- Implementation and onboarding fees (often 15 to 30% of year-one subscription)
- Integration costs with your ATS, HRIS, and calendar systems
- Internal training time (recruiter hours spent learning the tool, monetized at fully loaded hourly rate)
- Change management effort (manager time, internal communications, workflow redesign)
- Ongoing support and maintenance costs
- Increased volume management costs (AI can speed up applications; you may need more process capacity to handle the pipeline)
Ignoring these inflates your ROI. Including them makes the number smaller but far more defensible.
The formula only works if the inputs are honest, and that means having solid “before” numbers to compare against.
How to Set a Credible Pre-AI Baseline
The baseline is the single most important step in the entire measurement process. Without it, any improvement claim is anecdotal and will not survive a CFO’s questions.
When to measure:
- If you are currently hiring, collect 4 to 6 weeks of fresh data before deploying AI.
- If you have reliable ATS data, pull 6 to 12 months of historical metrics by role family and seniority level.
What to measure:
- Recruiter time allocation by stage: Have recruiters log their time for 2 to 4 weeks across sourcing, screening, scheduling, outreach, and admin. This gives you the “before” picture for time savings.
- Cost-per-hire by role family: Total recruiting spend divided by hires made, segmented by role type (entry-level, mid-level, senior, executive).
- Time-to-fill by role family: Calendar days from requisition open to offer acceptance.
- Agency spend as a percentage of total recruiting cost.
- Quality-of-hire proxies: 90-day retention rate, hiring manager satisfaction (if tracked), time to full productivity.
- Candidate experience metrics: Application completion rate, offer acceptance rate, candidate NPS (if available).
Lock the dataset: Once the baseline period ends, freeze it. Do not adjust it during or after the pilot. This prevents unconscious cherry-picking.
Account for seasonality: If your baseline covers a hiring surge (Q1 ramp, seasonal retail), compare pilot results to the equivalent period, not a slow quarter. Comparing peak-season baseline to slow-season pilot data will produce misleading results.
This step takes effort. It is also the difference between “we think AI is working” and “here is the data that proves it.” With a locked baseline in hand, you can run a controlled test that produces credible results.
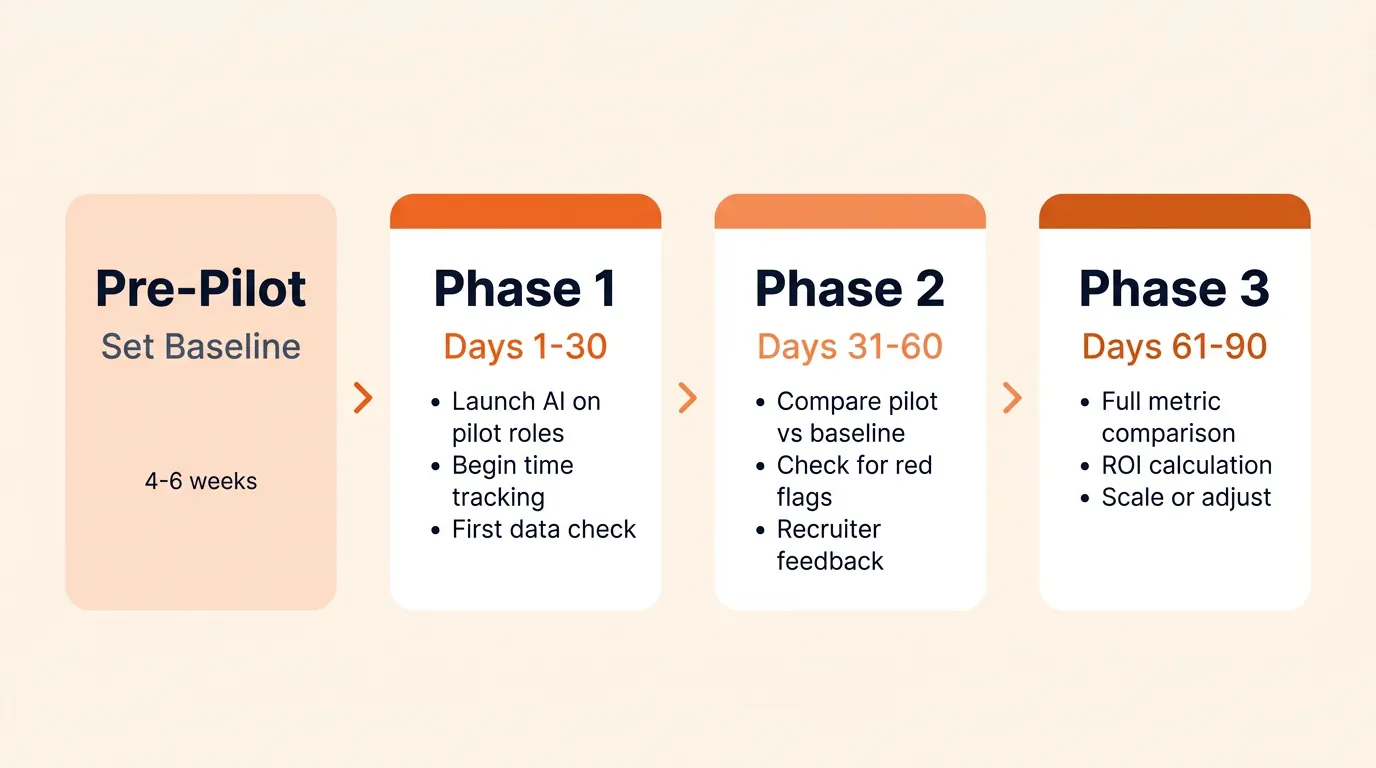
Running a Controlled Pilot (the 90-Day Framework)
A pilot is not optional if you want credible ROI data. Here is how to structure one that applies whether you are handling recruitment process automation for the first time or layering AI onto an existing workflow.
Pilot Setup
Duration: 60 to 90 days. Shorter pilots produce noisy data. Longer ones delay decisions without proportionally better evidence.
Role selection: Choose a high-volume or process-heavy role type (customer support, sales, or operations roles where you hire regularly enough to produce meaningful sample sizes within the pilot window).
Design options:
- Test vs control (preferred): Split requisitions so some use AI-assisted workflows while others use the existing process. This isolates the AI tool’s impact. Works best for teams with 10 or more hires per quarter.
- Pre-post comparison (practical alternative): If volume is too low for a split test, compare pilot results against the locked baseline for the same role types. Less rigorous, but still credible if the baseline was well-measured and conditions are comparable.
What to Measure During the Pilot
Track the same metrics as the baseline, plus:
- Recruiter hours saved per requisition (self-reported time logs vs baseline)
- Cost-per-hire for pilot roles vs control/baseline
- Time-to-fill for pilot roles vs control/baseline
- Quality-of-hire proxies (track from hire date; some metrics like retention become available 90+ days after the pilot ends)
- Offer acceptance rate
- Recruiter and hiring manager satisfaction with the AI-assisted process
- Unexpected costs such as increased application volume, false positives requiring manual review, or training time that exceeded projections
Check at 30, 60, and 90 Days
Do not wait until the end to review data. Measure at 30-day intervals so you can spot problems early, such as the tool generating volume without improving quality, or recruiters spending as much time managing AI outputs as they previously spent on manual screening.
Red Flags to Watch For
- Volume without signal: AI speeds up the top of the funnel, generating more candidates, but quality of shortlists does not improve.
- Task shifting, not task reduction: Recruiters spend less time screening but more time reviewing AI recommendations, correcting false positives, and managing a larger pipeline. Net time savings are negligible.
- Candidate experience drops: Faster automation can feel impersonal. Monitor application completion rates and candidate feedback.
Once the pilot is running, the question becomes which numbers to focus on. Not every metric in your ATS dashboard matters equally for ROI.
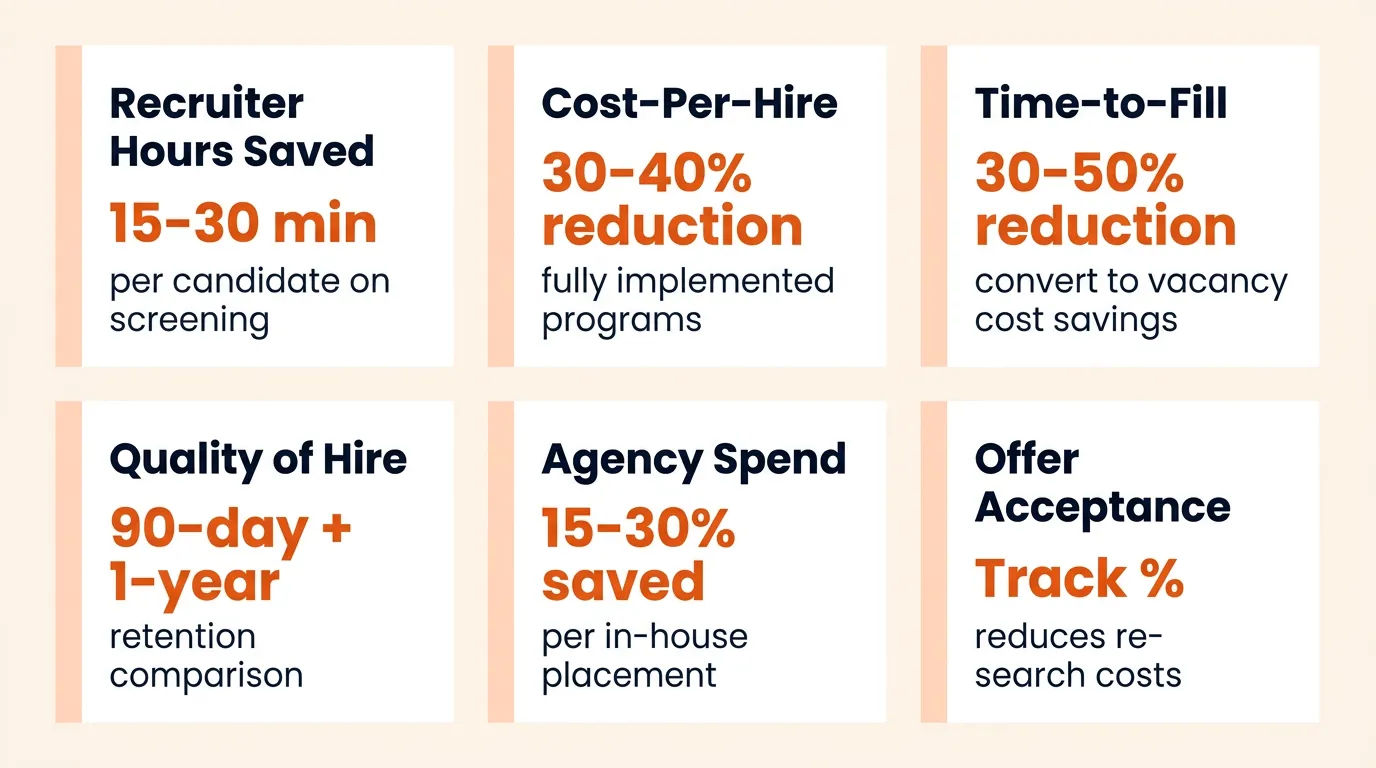
The Six Metrics That Actually Matter
Many AI recruiting dashboards track dozens of data points. For ROI measurement, focus on these six. They are the ones that translate directly into the business case.
-
Recruiter hours saved per requisition: Compare time logs before and during the pilot. Monetize at fully loaded hourly rate. Typical range: 15 to 30 minutes saved per candidate on screening; 5 to 8 hours per week on scheduling.
-
Cost-per-hire reduction: Total recruiting cost for pilot roles divided by hires made, compared to baseline. Typical AI impact: 30 to 40% reduction in fully implemented programs. Factor in all costs, not just direct spend.
-
Time-to-fill improvement: Calendar days from requisition open to offer acceptance. Typical AI impact: 30 to 50% reduction. Convert to dollars using the cost-of-vacancy calculation.
-
Quality-of-hire proxies: Compare the AI-assisted cohort to the pre-AI cohort on: 90-day retention, 1-year retention, hiring manager satisfaction, time to full productivity, and first-year performance ratings. This metric takes the longest to mature but carries the most weight.
-
Agency spend avoidance: Total agency fees before AI vs after. If you sourced roles in-house that previously went to agencies, the delta is direct, defensible ROI.
-
Offer acceptance rate: Track whether faster, more responsive processes improve candidate acceptance. Every declined offer means re-running a search, so even small improvements have a compounding cost impact.
Other metrics (diversity hiring effectiveness, candidate NPS, source channel ROI) are useful but secondary for the core calculation. Track them separately.
Even with the right metrics in place, there are predictable traps that inflate or deflate your ROI number.
Common ROI Measurement Mistakes (and How to Avoid Them)
Most AI recruiting ROI claims do not survive scrutiny because of a few predictable errors.
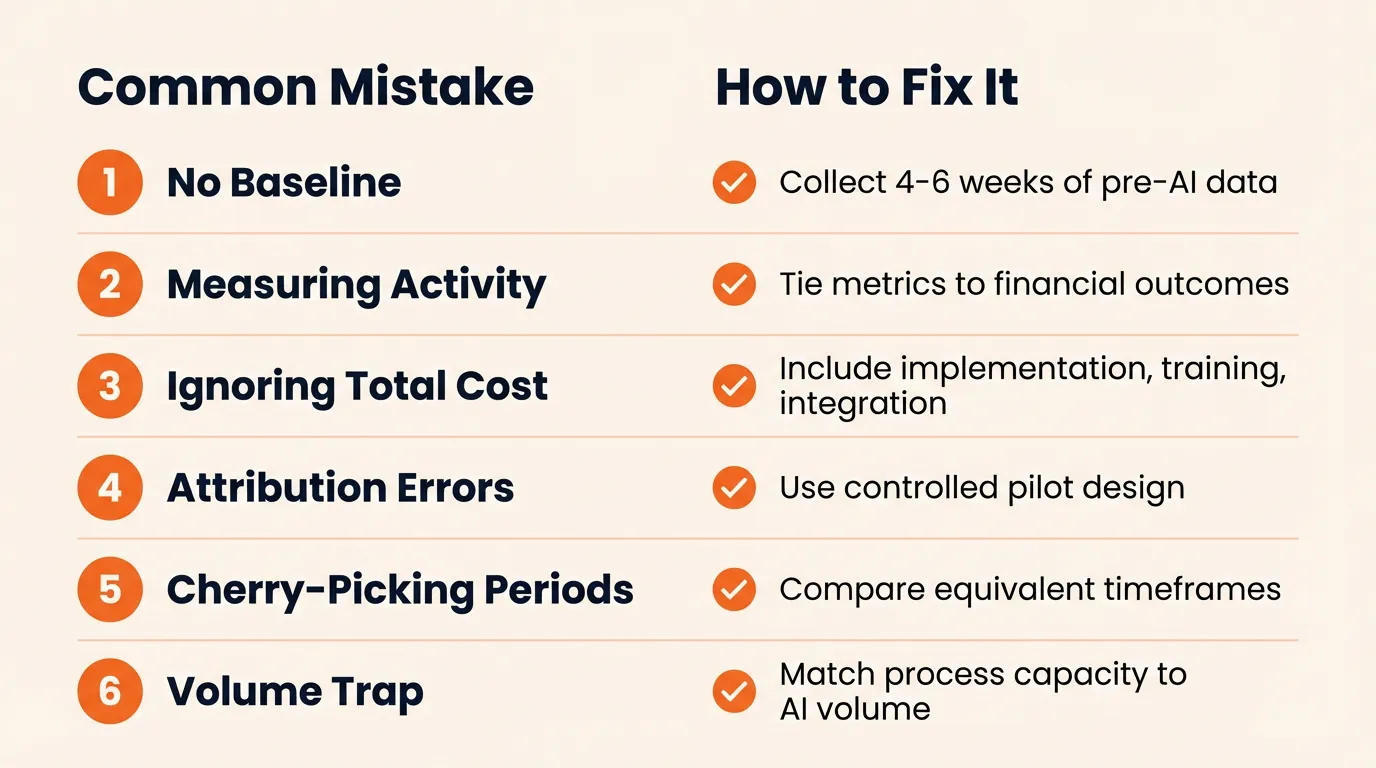
No baseline: The most common and most damaging mistake. Without pre-AI data, “improvement” is a story, not evidence. Fix: invest the 4 to 6 weeks before deployment.
Measuring activity instead of outcomes: “We screened 500 more candidates” is not ROI. “We filled the same roles 12 days faster at $1,200 less per hire” is. Fix: tie every metric to a financial outcome or a quality indicator.
Ignoring total cost of ownership: Subscription is the line item everyone remembers. Implementation, integration, training, and change management costs often equal 30 to 50% of first-year software spend. Fix: build a full TCO model before calculating returns.
Attribution errors: A cost-per-hire drop could come from market conditions, salary adjustments, or employer brand changes. Fix: use a controlled pilot or, at minimum, compare equivalent role types and time periods.
Cherry-picking time periods: Measuring ROI during a hiring surge and comparing to a slow quarter creates false positives. Fix: use equivalent seasonal periods or rolling averages.
The volume trap: AI can increase application volume significantly. If your team lacks the process capacity to handle more candidates, time savings from screening get offset by increased coordination. According to a People Matters analysis, nearly 3 in 4 organizations struggle to achieve tangible returns despite AI adoption, partly because traditional HR metrics capture activity rather than business outcomes.
Avoiding these mistakes puts you in a much stronger position. But what should you actually expect the numbers to look like?
Realistic ROI Benchmarks: What the Data Actually Shows
Here is what the evidence supports, with caveats.
Conservative range (typical implementation):
- 2x to 5x ROI in year one
- Payback period: 60 to 120 days
- Cost-per-hire: drops from the $5,000 to $6,000 range to $2,500 to $3,500
- Time-to-fill: 30 to 50% reduction
Strong implementation range (full-funnel AI, 300+ hires per year):
- 4x to 8x ROI in year one
- Cost-per-hire below $2,500
- Time-to-fill under 20 days for roles that previously took 40 to 60
The productivity multiplier: For a company making 400 hires per year, even a 7-day time-to-fill improvement at roughly $1,000/day blended vacancy cost yields approximately $2.8 million in returned productivity, before counting recruiter efficiency gains or agency savings.
The honest caveat: A significant share of HR leaders report their organizations have not realized meaningful business value from AI tools, a finding consistent across multiple 2025 industry surveys. The gap is not the technology. It is measurement methodology, change management, and process redesign. The teams seeing 4x to 8x returns paired the tool with workflow changes, clear baselines, and rigorous tracking. The teams seeing little return deployed AI on top of existing processes without changing anything else.
SHRM’s 2025 data makes the point sharply: only 20% of organizations track quality of hire. The majority measure inputs (how much they spend, how long it takes) without connecting them to the outcome that matters most (whether they hired the right person).
Having the data is the first half. Translating it into a business case that gets leadership to act is the second.
How to Present AI Recruiting ROI to Leadership
Measuring ROI is half the job. Presenting it so leadership acts on it is the other half.
Speak in finance terms, not recruiting jargon: CFOs respond to payback period, annualized net savings, cost avoidance, and risk reduction. “We reduced time-to-fill by 15 days” lands harder when followed by “which eliminated $450,000 in annual vacancy costs across 120 hires.”
Present two scenarios: Always model a conservative and an aggressive case. Never present only the best outcome. This builds credibility and shows you have stress-tested the numbers.
Structure the business case:
- Current state costs (your baseline data)
- Projected savings by category (recruiter hours, cost-per-hire, agency spend, time-to-fill)
- Total cost of ownership (subscription + implementation + training + integration + change management)
- Net ROI and payback period (both scenarios)
- Strategic benefits reported as narrative, not in the ROI number (quality of hire, candidate experience, diversity)
Lead with the payback period: If your pilot shows payback in under 6 months, make that the opening number. It immediately answers the executive’s first question: “How fast do we get this back?”
Separate the qualitative wins: Candidate experience improvements, recruiter satisfaction, and diversity hiring progress belong in the presentation, but not in the ROI calculation. Keeping the core number conservative and adding the qualitative narrative separately makes the whole case stronger.
Position measurement as an advantage: SHRM reports that only 20% of organizations track quality of hire. If your team does, say so. It positions you as operating at a level most hiring functions have not reached.
Conclusion
AI recruiting ROI is real, but only provable when you measure it properly.
The framework is straightforward: set a pre-AI baseline with 4 to 6 weeks of data. Run a 60 to 90-day controlled pilot. Track six core metrics tied to financial outcomes. Build total cost of ownership into the calculation, not just subscription cost. Present two scenarios to leadership with the payback period front and center.
Most teams that claim AI recruiting ROI have not measured it rigorously. The ones who do earn continued investment, maintain credibility with finance, and can actually distinguish between tools that deliver value and tools that only look like they work.
If you want a low-risk way to start, Craze is a multi-model AI workspace you can use free to build and test AI-assisted workflows, including the kind of measurement pilot described here.
FAQs
What is a good ROI for an AI recruiting platform?
A realistic first-year ROI ranges from 2x to 5x for most implementations. Teams with full-funnel AI deployment and strong measurement practices see 4x to 8x. Be cautious of any vendor guaranteeing double-digit multiples without knowing your current baseline, hiring volume, or process maturity.
How long does it take to see ROI from AI recruiting tools?
Time-to-fill and cost-per-hire improvements typically show up within 60 to 90 days of a well-structured pilot. Quality-of-hire improvements take longer, usually 6 to 12 months, because you need retention data and performance reviews to validate whether AI-assisted hires are actually better.
Which metric matters most when measuring AI recruiting ROI?
Cost-per-hire reduction is the easiest to quantify and the metric most leaders understand immediately. Quality-of-hire improvement is the most valuable long-term, but the hardest to isolate and measure. A strong business case needs both.
Can small teams or agencies measure AI recruiting ROI?
Yes. Small teams may not have the volume for a formal test-vs-control split, but a pre-post comparison against a locked baseline still produces credible data. Agencies can track placement rate, time-to-placement, and recruiter hours per placement before and after AI adoption.
What if our AI recruiting ROI is negative?
A negative ROI in the pilot phase is useful data, not a failure. It usually indicates the tool is solving the wrong bottleneck, the team did not receive adequate training, or the process was not redesigned to take advantage of automation. Review the pilot data to identify which metric underperformed.
More Articles
15+ AI Agent Examples That Are Actually Delivering Results

See real AI agent examples from companies like Uber, TELUS, and Intercom. Organized by function with actual business results, not just product names.
AI Agent Builders: How to Pick the Right Approach for Your Team
Compare no-code AI agent builders, developer frameworks, and custom approaches. Includes a decision matrix, cost ranges, and production readiness checklist.
How to Build an AI Agent (Even If You Can't Code)
Learn how to build an AI agent using no-code tools, frameworks like LangChain, or custom Python. Covers scoping, costs, and mistakes to avoid.

